

- The dashboard at app.momentic.ai: uploaded run data with videos, traces, auto-heal history, and quarantine state.
- Local reports: JUnit XML, Allure, Playwright JSON, or Buildkite JSON, for feeding into other CI tooling.
Uploading to the dashboard
Pass the upload flag on anyrun invocation:
MOMENTIC_API_KEY, or the CLI’s --api-key option.
Group independent invocations
If your orchestrator starts separate CLI processes for one batch, generate one UUID and pass it to every invocation:momentic results upload calls. After Momentic indexes the uploads, their
physical runs appear in the same run group.
This is an eventually consistent group, not a finalized batch. Use the same UUID
and consistent suite, project, and Git metadata for every invocation. After your
orchestrator submits every upload, it can start triage immediately with the
shared UUID; triage waits for normal upload indexing, not for the run group to
assemble. Upload each result directory separately; do not merge the archives
first.
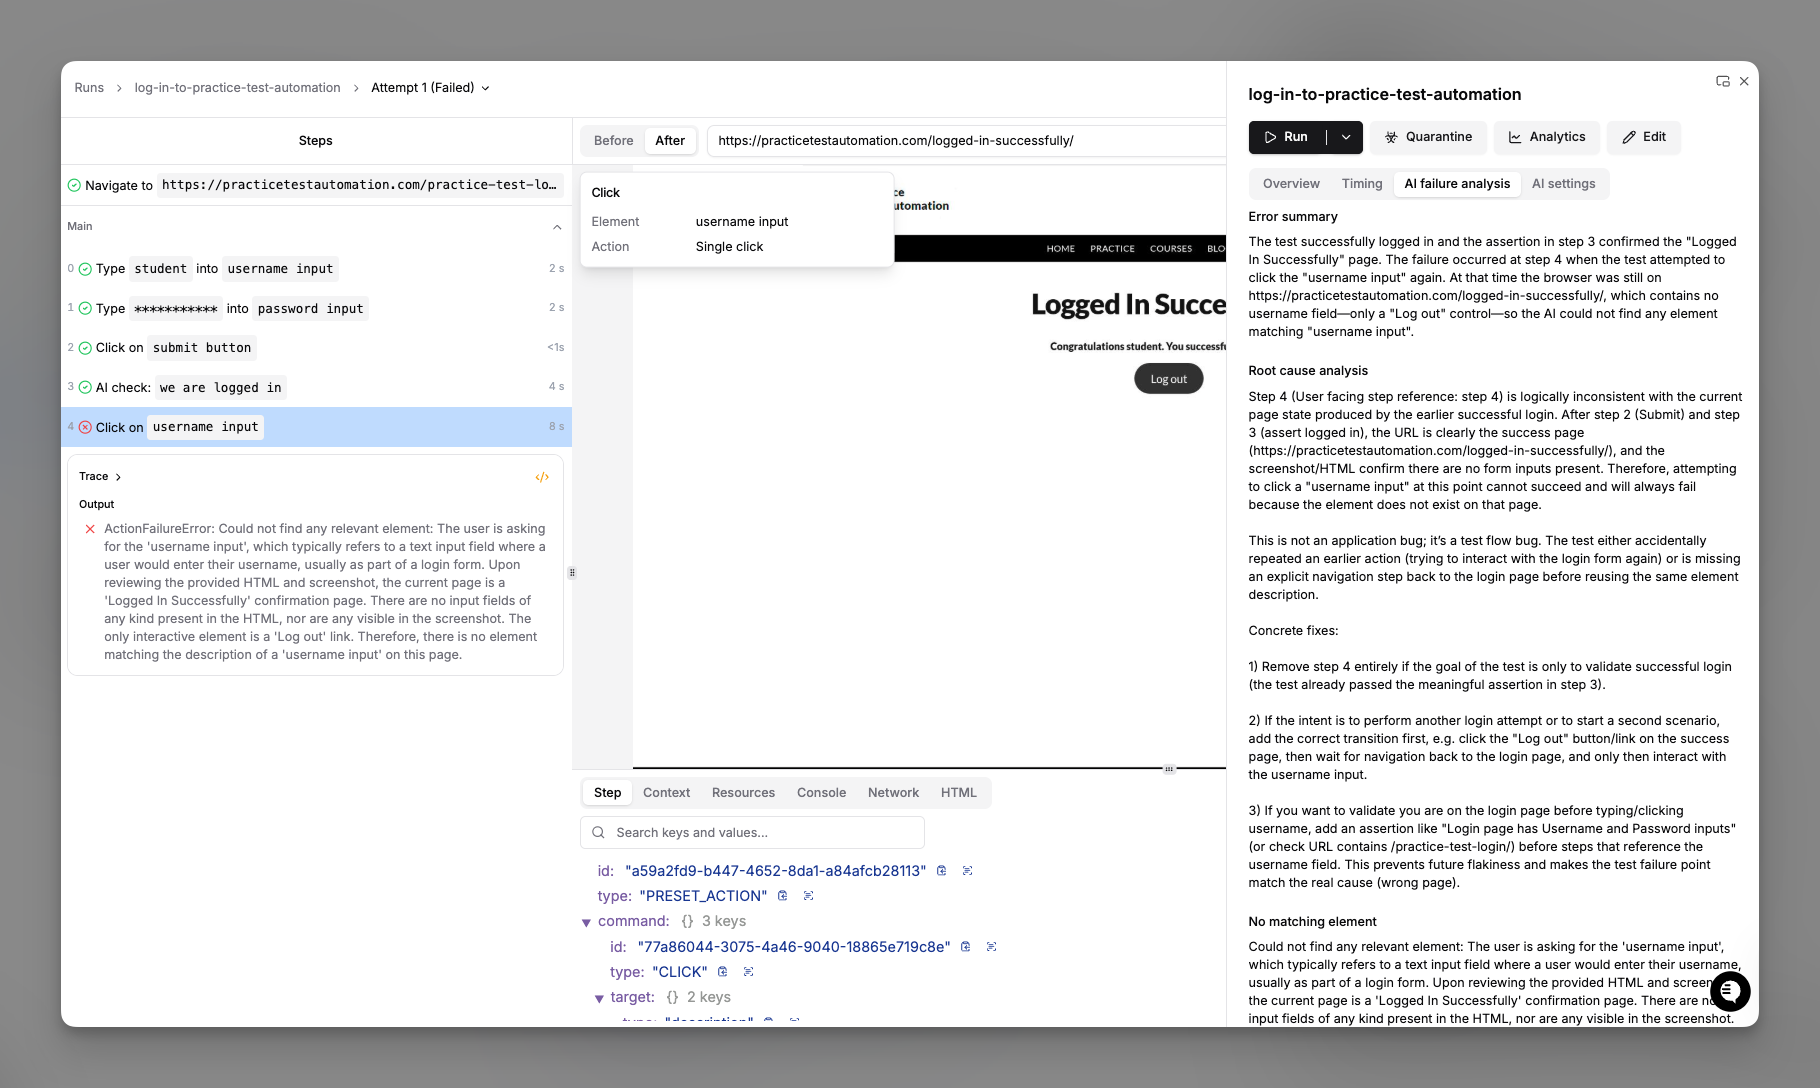
Runs view in the dashboard
- Status: pass, fail, flaky, quarantined, cancelled
- Duration and cost: time the run took plus AI token usage
- Environment and branch: which env and Git branch the run targeted
- Trigger: CLI, API, scheduled, or manual
Filtering
Filter runs by test name or label, environment or branch, status, time range, or trigger type. Saved filters live in the left sidebar.Drilling into a run
Each run page shows every step with its status, duration, and artifacts. Click a step to view its video replay, trace (DOM, network, console), screenshots, auto-heal traces when healing fired, and AI reasoning. For steps that used element location, the detail pane also includes a Cache section showing whether the step used cache, missed cache, busted cache before use, or had no cache, along with the reason when available. In the dashboard, the Cache section of a cached step also lets you inspect and invalidate the entry without leaving the run. This works for web and mobile runs, however they were triggered:- Expand Cached value to read the stored locator or assertion result.
- Choose Clear step cache to drop the entry; the next run re-resolves the step with AI. A run on a feature branch clears the entry for that branch only; a run on your main branch clears it everywhere.
- Conditional rows read as
If ...and show the evaluated outcome inline as= trueor= false. - Retried steps collapse to one final row with a retry count; expand it to see
each
Attempt N. - While loops expand into
Iteration Ngroups so each pass through the body is inspectable.
momentic results view
(or
momentic-mobile results view
for mobile).
Sharing
Each run has a shareable URL. Team members with workspace access can open it directly.Generating local reports
Pass--reporter to run to emit a standardized report file into the
reporterDir (defaults to
./reports):
See
momentic run and
momentic-mobile run
for the full CLI flag reference.
Real output from
npx momentic run login.test.yaml --reporter junit --reporter json against a
one-test project:
run_url in JUnit is the
dashboard link directly; runId in JSON is the identifier, so build the link as
https://app.momentic.ai/runs/<runId>.
Live run progress
While a run is in flight,momentic run and momentic-mobile run write a
progress.json file to the top of the
--output-dir (defaults to
./test-results). It is updated as steps complete, so you can poll it to track
long runs (for example, to report that a test has finished “53 of 70 steps”) or
forward it to your own reporting pipeline.
The file holds an aggregate roll-up plus one entry per test run:
totalStepsinitially counts the run’s resolved top-levelbefore, main, andaftersteps.completedStepscounts terminal step results and excludes steps added by failure recovery. If completed results exceed the initial total, the writer raisestotalStepsto match; treat it as progress, not a fixed percentage for every nested or retried flow.- The file is written atomically and updated on a short throttle, so a reader always sees a complete, valid JSON document.
- When tests are sharded across multiple machines, each shard has its own
--output-dirand therefore its ownprogress.json. When tests run across parallel workers on a single machine, the parent process writes one mergedprogress.jsoncovering all workers.
CI integration
Every CI/CD template uploads results by default. See your CI provider’s page for the ready-to-paste config.Artifacts
Failed runs include:- Video: enable via
recordVideoinmomentic.config.yaml - Trace: always captured on failure
- Screenshots: captured at each step
- Auto-heal traces: shown in the run viewer when auto-heal fires
outputDir, which defaults to
./test-results; standardized report files live under
reporterDir.
Viewing runs outside the dashboard
The result viewer that powersmomentic results view also ships as a static
bundle you can host yourself. Use it to serve run results from your own
infrastructure. See
Self-host the result viewer.